 |
Today, we are announcing a new feature, Log Anomaly Detection and Recommendations for Amazon DevOps Guru. With this feature, you can find anomalies throughout relevant logs within your app, and get targeted recommendations to resolve issues. Here’s a quick look at this feature:
AWS launched DevOps Guru, a fully managed AIOps platform service, in December 2020 to make it easier for developers and operators to improve applications’ reliability and availability. DevOps Guru minimizes the time needed for issue remediation by using machine learning models based on more than 20 years of operational expertise in building, scaling, and maintaining applications for Amazon.com.
You can use DevOps Guru to identify anomalies such as increased latency, error rates, and resource constraints and then send alerts with a description and actionable recommendations for remediation. You don’t need any prior knowledge in machine learning to use DevOps Guru, and only need to activate it in the DevOps Guru dashboard.
New Feature – Log Anomaly Detection and Recommendations
Observability and monitoring are integral parts of DevOps and modern applications. Applications can generate several types of telemetry, one of which is metrics, to reveal the performance of applications and to help identify issues.
While the metrics analyzed by DevOps Guru today are critical to surfacing issues occurring in applications, it is still challenging to find the root cause of these issues. As applications become more distributed and complex, developers and IT operators need more automation to reduce the time and effort spend detecting, debugging, and resolving operational issues. By sourcing relevant logs in conjunction with metrics, developers can now more effectively monitor and troubleshoot their applications.
With this new Log Anomaly Detection and Recommendations feature, you can get insights along with precise recommendations from application logs without manual effort. This feature delivers contextualized log data of anomaly occurrences and provides actionable insights from recommendations integrated inside the DevOps Guru dashboard.
The Log Anomaly Detection and Recommendations feature is able to detect exception keywords, numerical anomalies, HTTP status codes, data format anomalies, and more. When DevOps Guru identifies anomalies from logs, you will find relevant log samples and deep links to CloudWatch Logs on the DevOps Guru dashboard. These contextualized logs are an important component for DevOps Guru to provide further features, namely targeted recommendations to help faster troubleshooting and issue remediation.
Let’s Get Started!
This new feature consists of two things, “Log Anomaly Detection” and “Recommendations.” Let’s explore further into how we can use this feature to find the root cause of an issue and get recommendations. As an example, we’ll look at my serverless API built using Amazon API Gateway, with AWS Lambda integrated with Amazon DynamoDB. The architecture is shown in the following image:
If it’s your first time using DevOps Guru, you’ll need to enable it by visiting the DevOps Guru dashboard. You can learn more by visiting the Getting Started page.
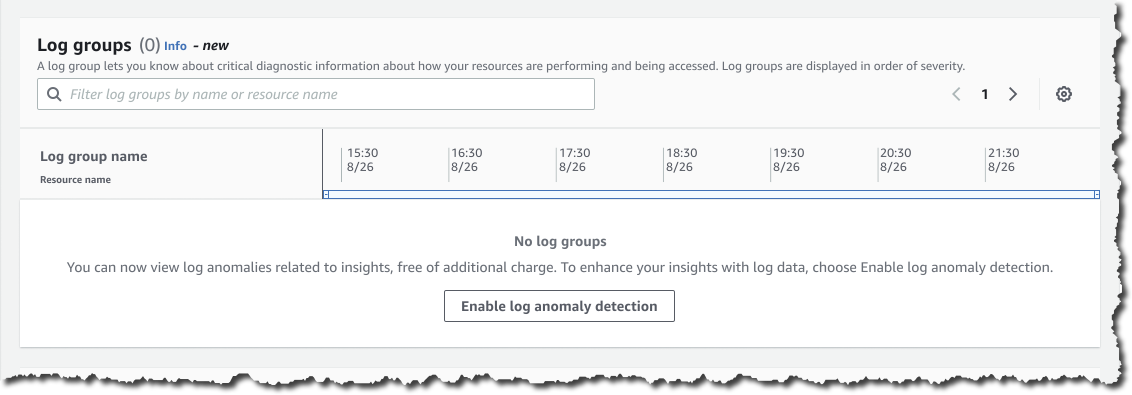
Since I’ve already enabled DevOps Guru I can go to the Insights page, navigate to the Log groups section, and select the Enable log anomaly detection.
Log Anomaly Detection
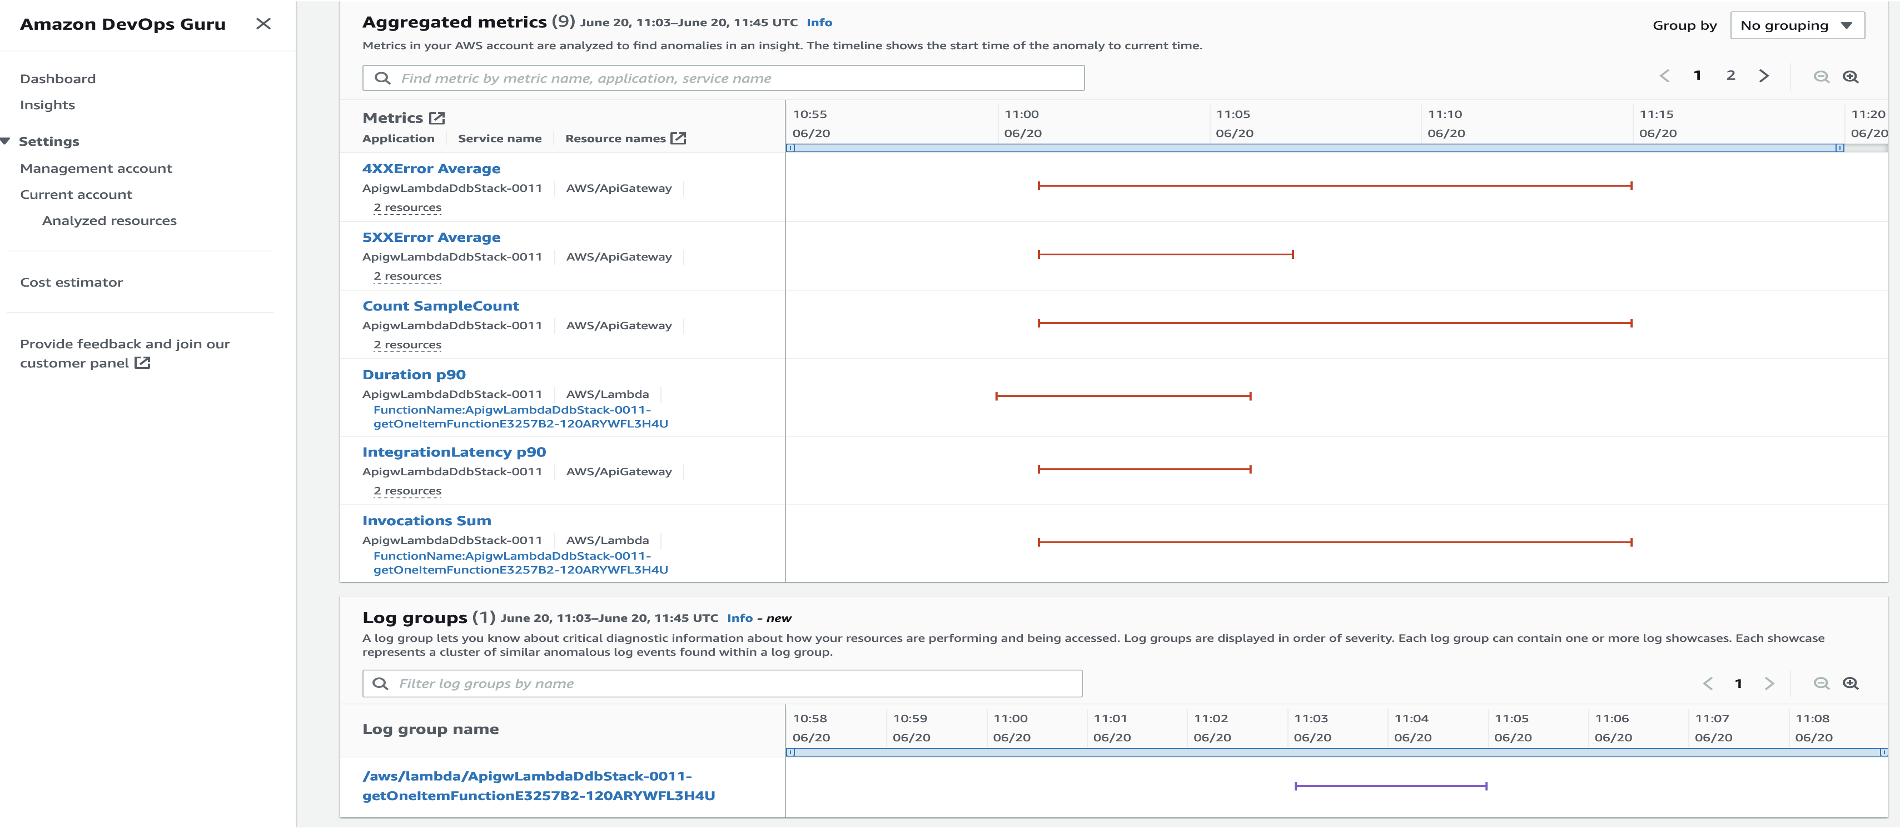
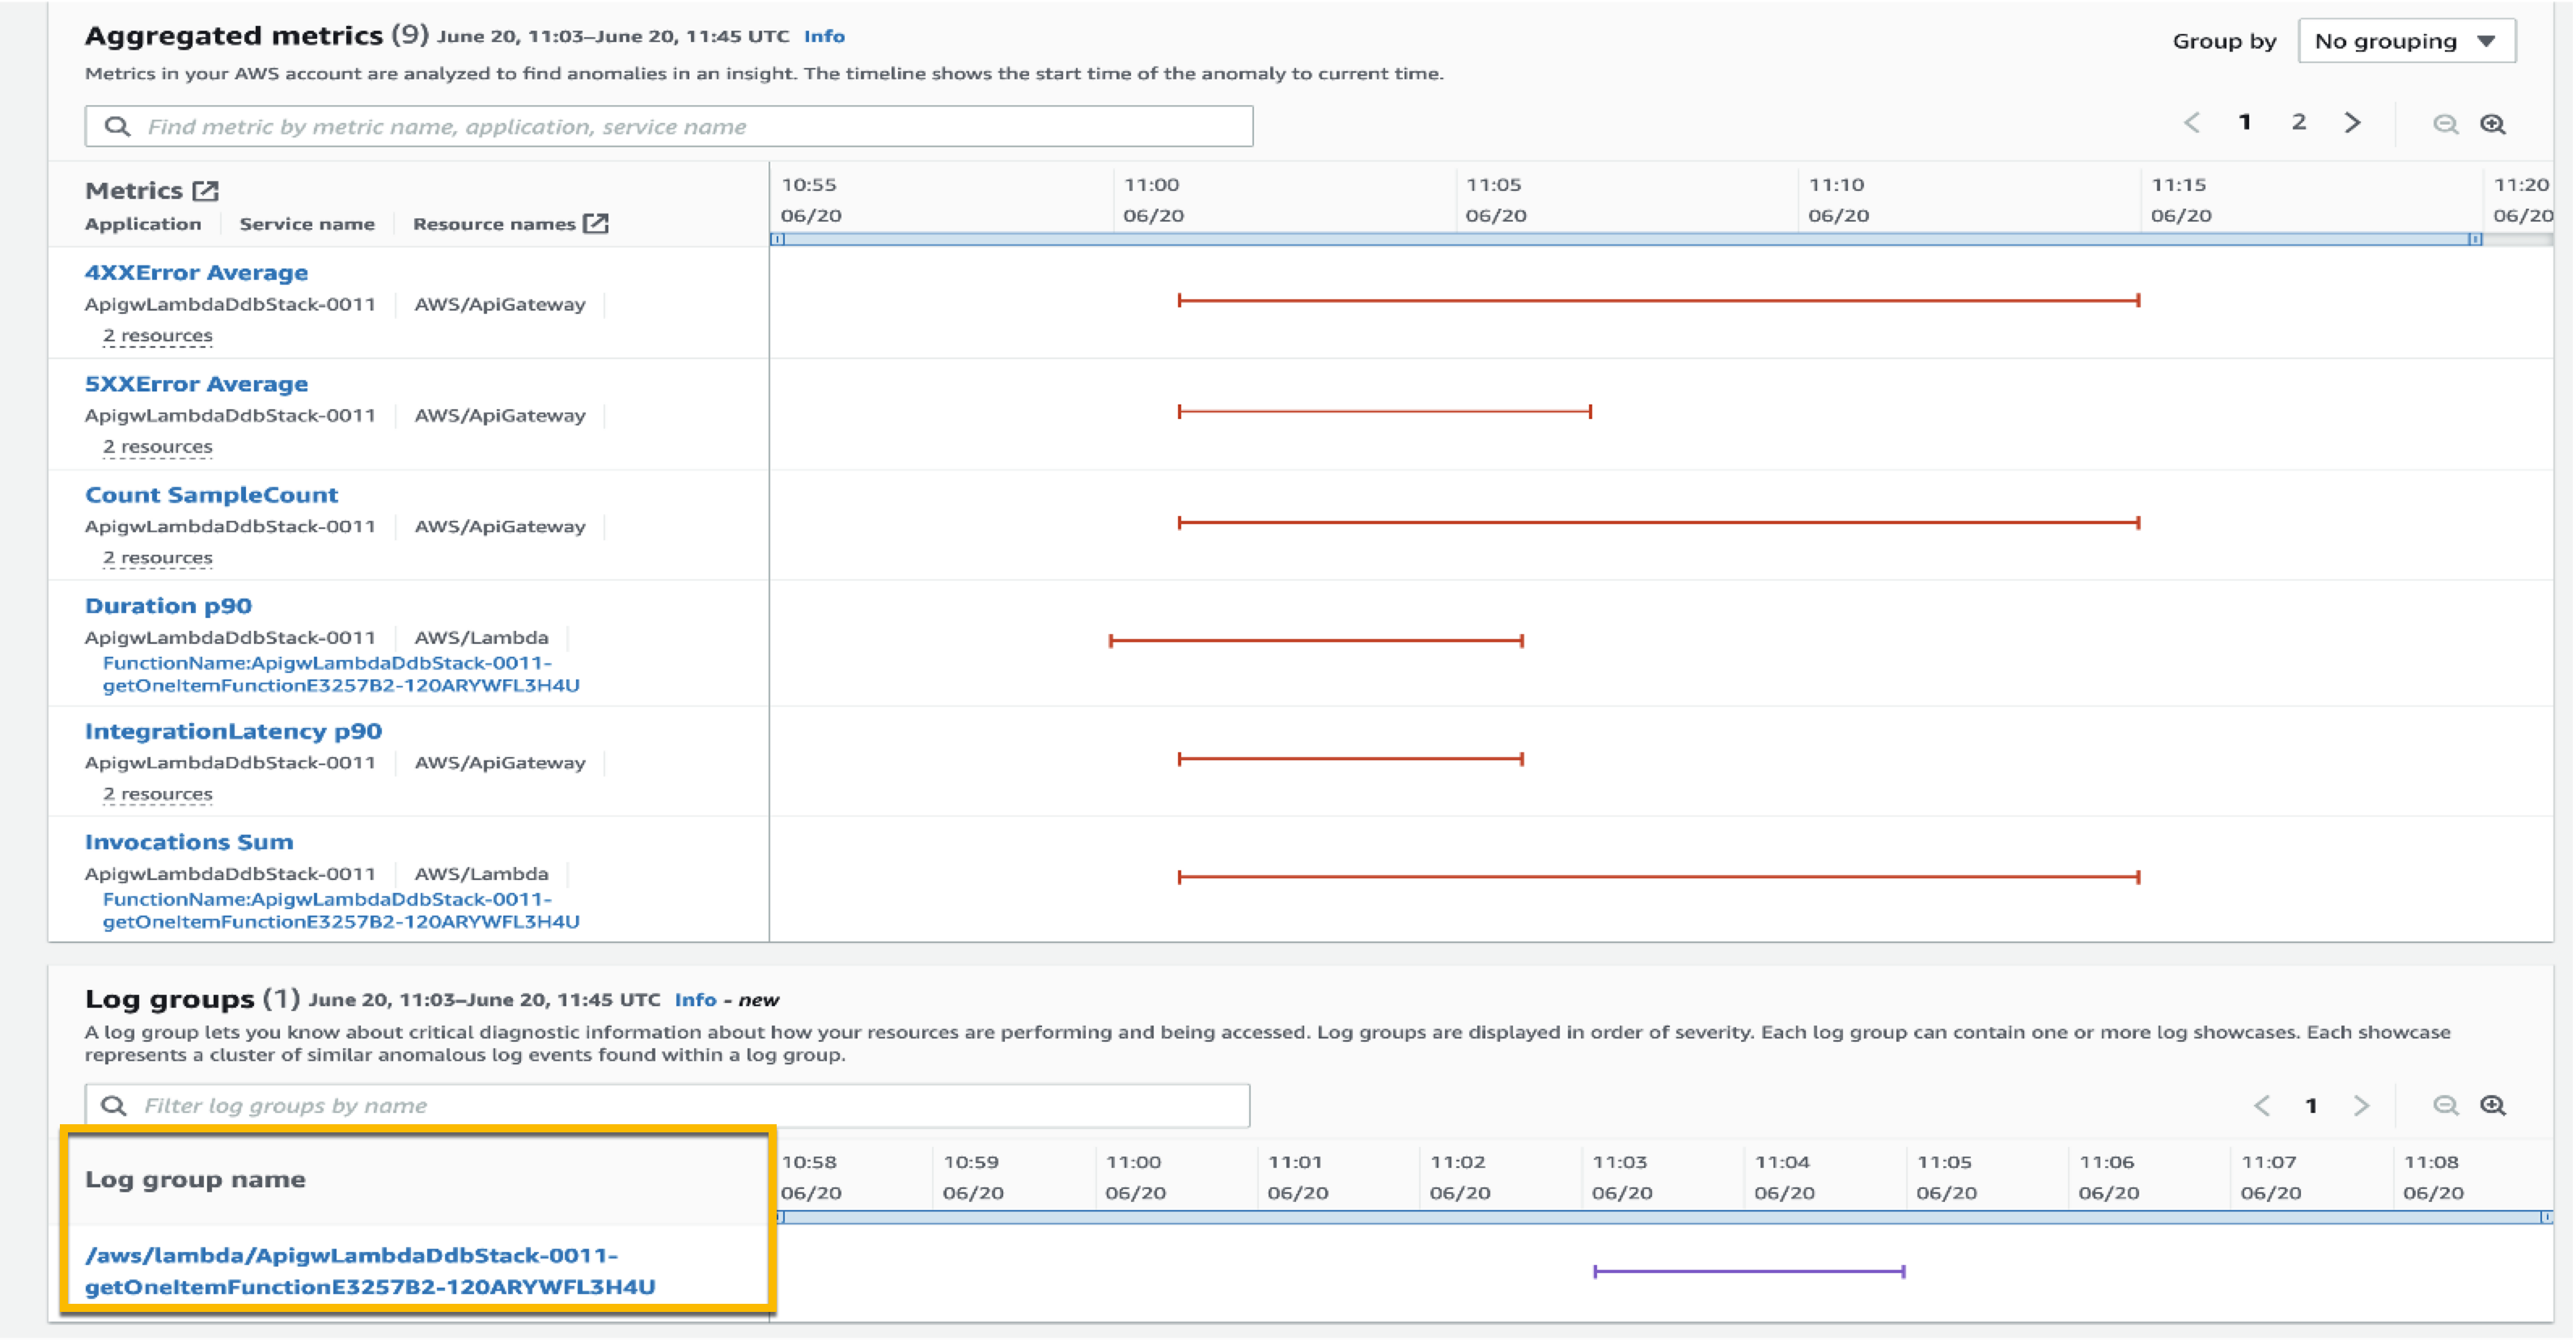
After a few hours, I can visit the DevOps Guru dashboard to check for insights. Here, I get some findings from DevOps Guru, as seen in the following screenshots:
With Log Anomaly Detection, DevOps Guru will show the findings of my serverless API in the Log groups section, as seen in the following screenshot:
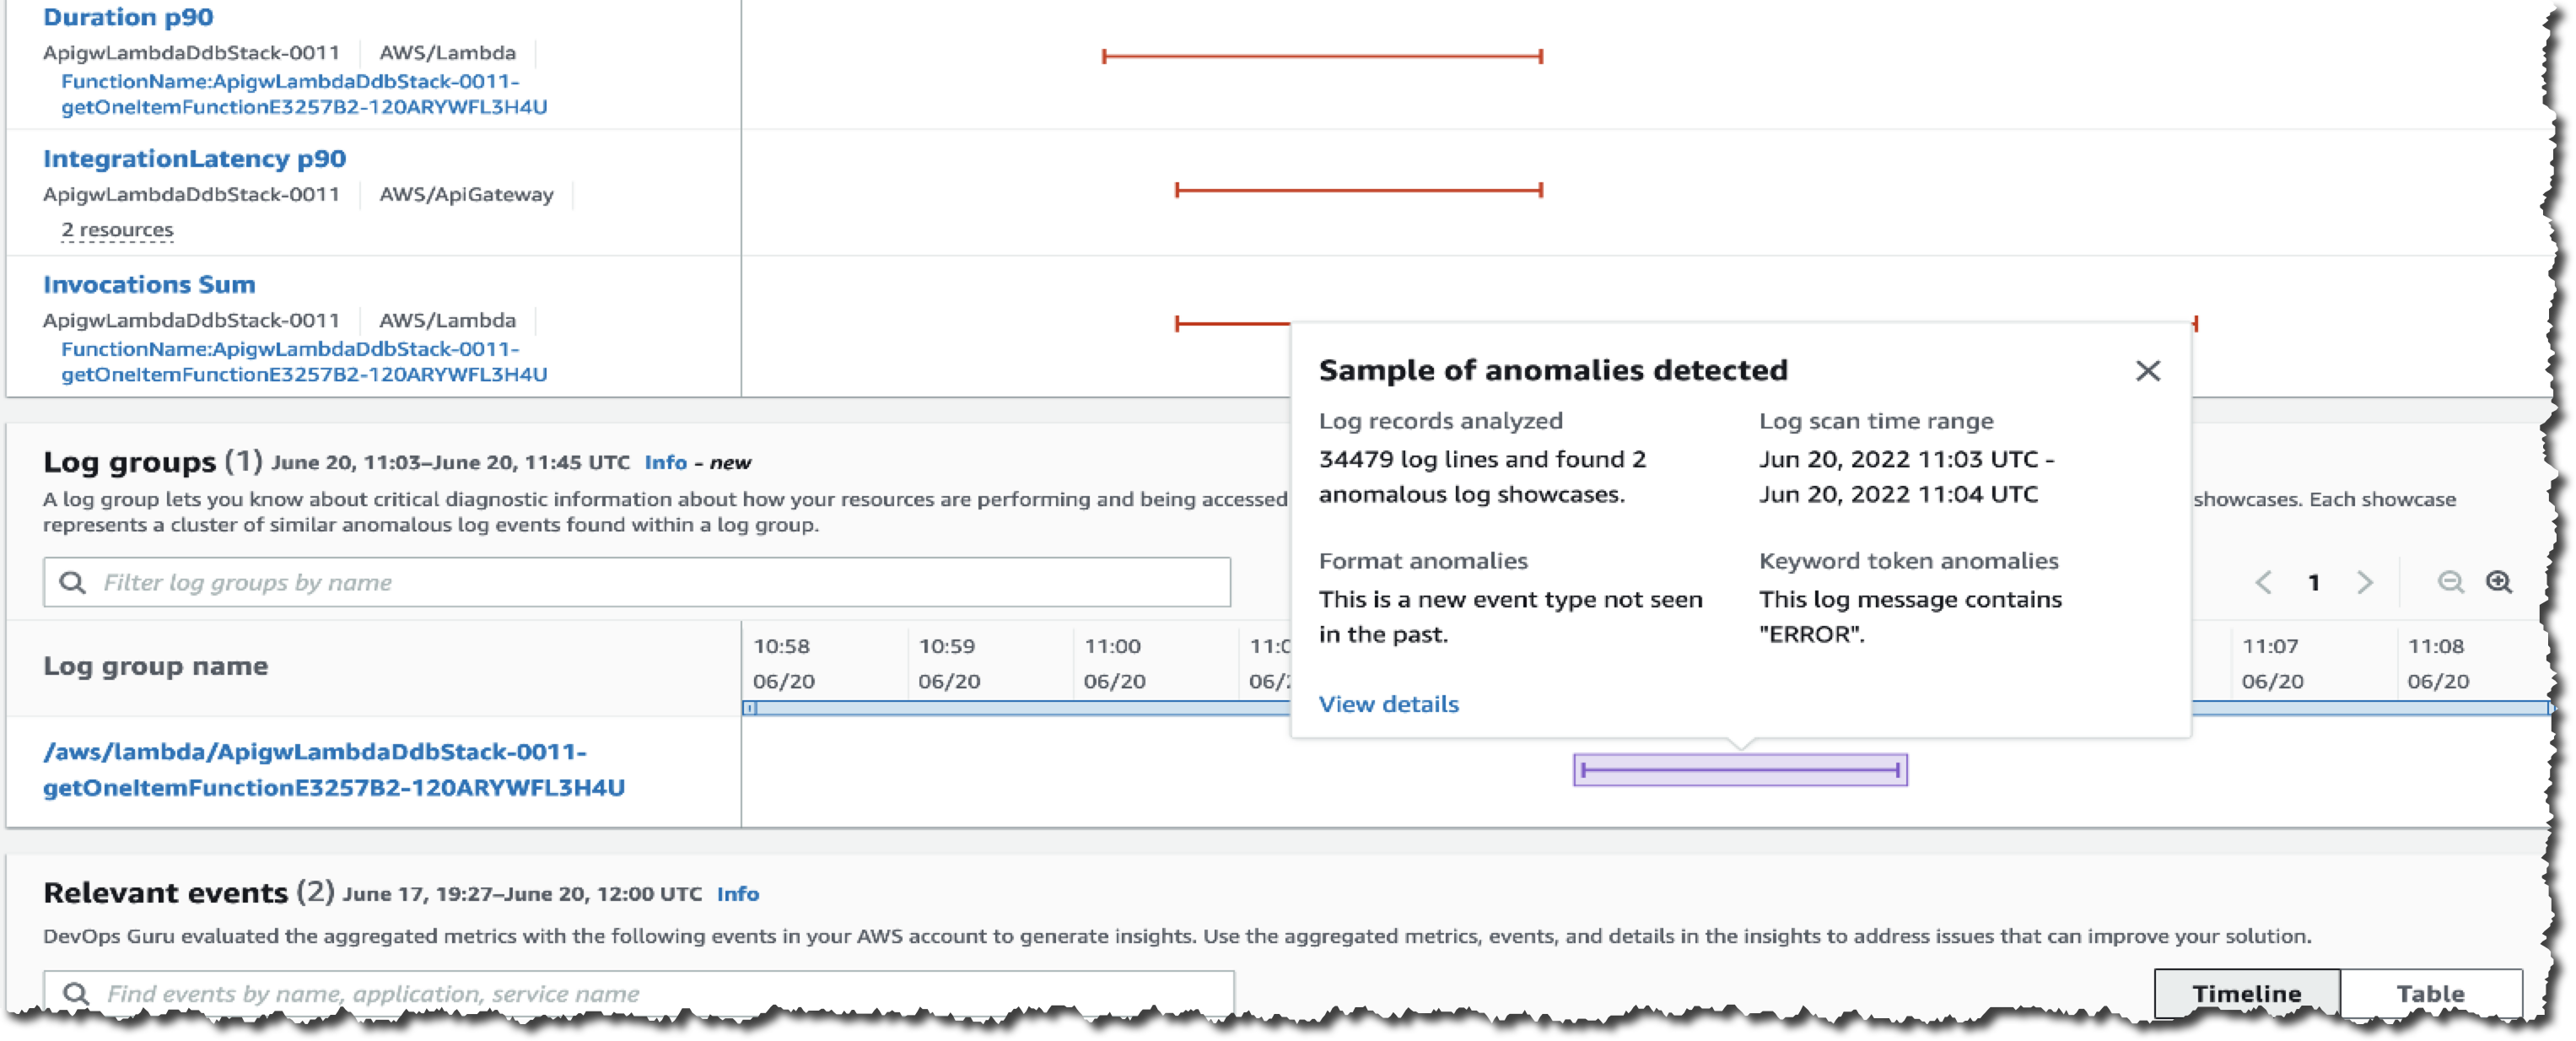
I can hover over the anomaly and get a high-level summary of the contextualized enrichment data found in this log group. It also provides me with additional information, including the number of log records analyzed and the log scan time range. From this information, I know these anomalies are new event types that have not been detected in the past with the keyword ERROR.
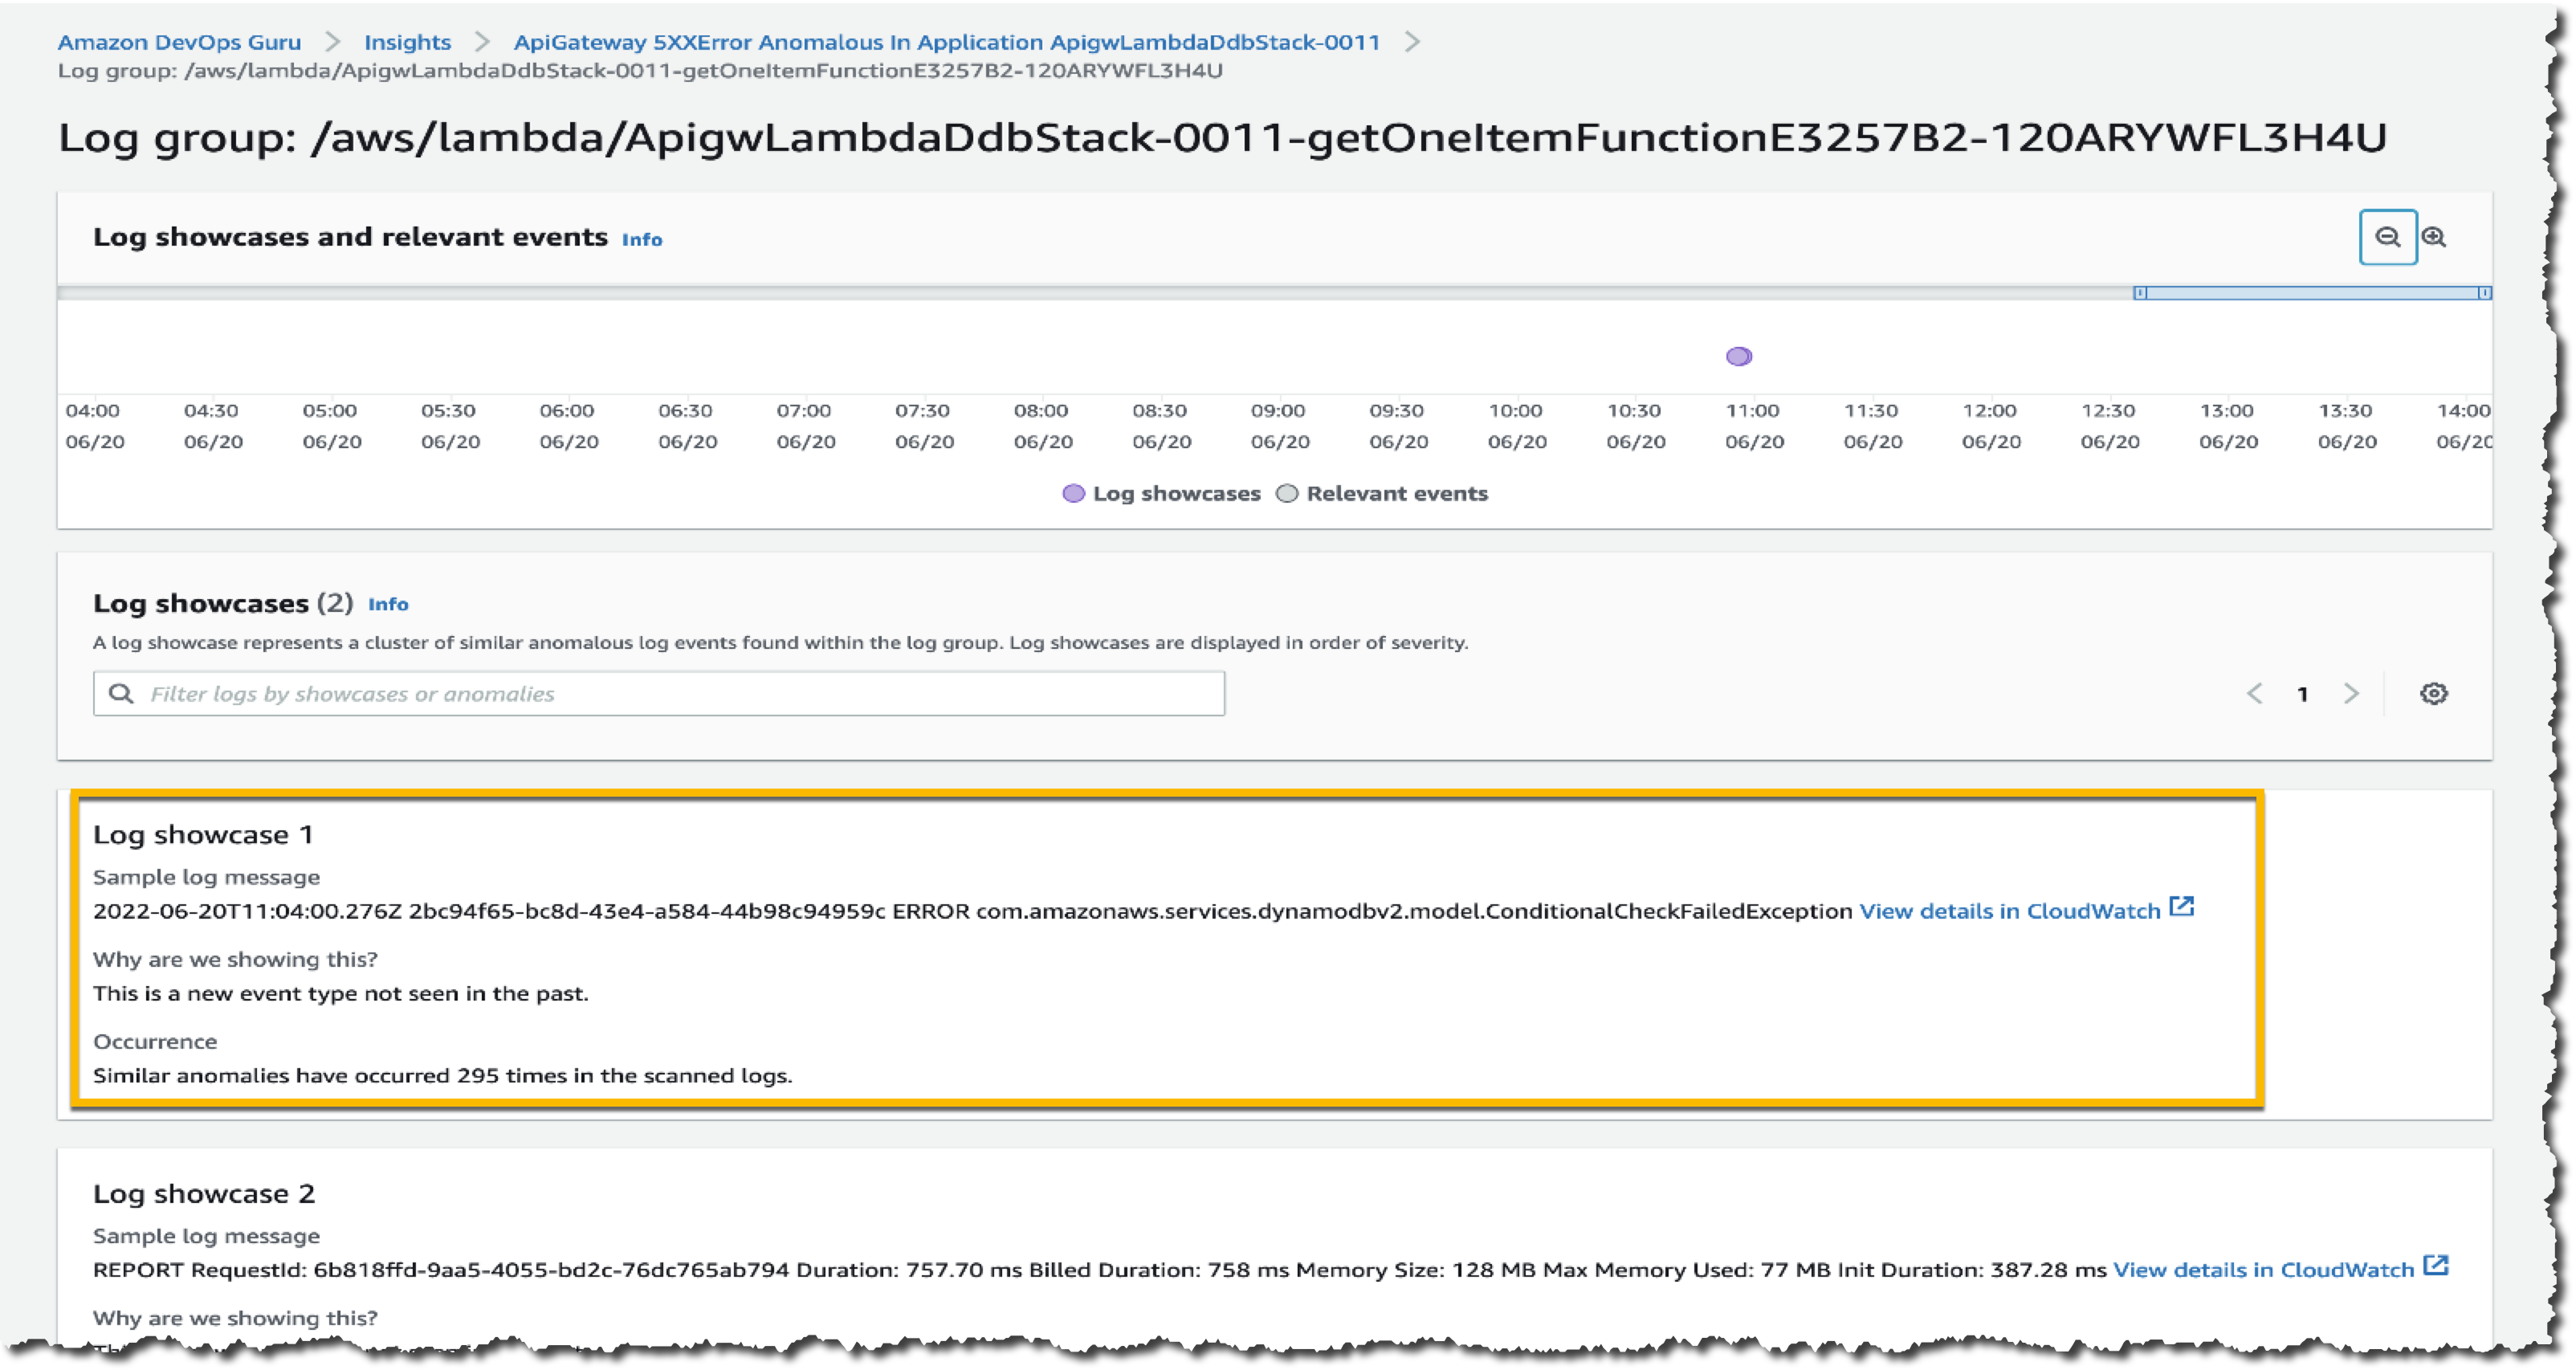
To investigate further, I can select the log group link and go to the Detail page. The graph shows relevant events that might have occurred around these log showcases, which is a helpful context for troubleshooting the root cause. This Detail page includes different showcases, each representing a cluster of similar log events, like exception keywords and numerical anomalies, found in the logs at the time of the anomaly.
Looking at the first log showcase, I noticed a ConditionalCheckFailedException error within the AWS Lambda function. This can occur when AWS Lambda fails to call DynamoDB. From here, I learned that there was an error in the conditional check section, and I reviewed the logic on AWS Lambda. I can also investigate related CloudWatch Logs groups by selecting View details in CloudWatch links.
One thing I want to emphasize here is that DevOps Guru identifies significant events related to application performance and helps me to see the important things I need to focus on by separating the signal from the noise.
Targeted Recommendations
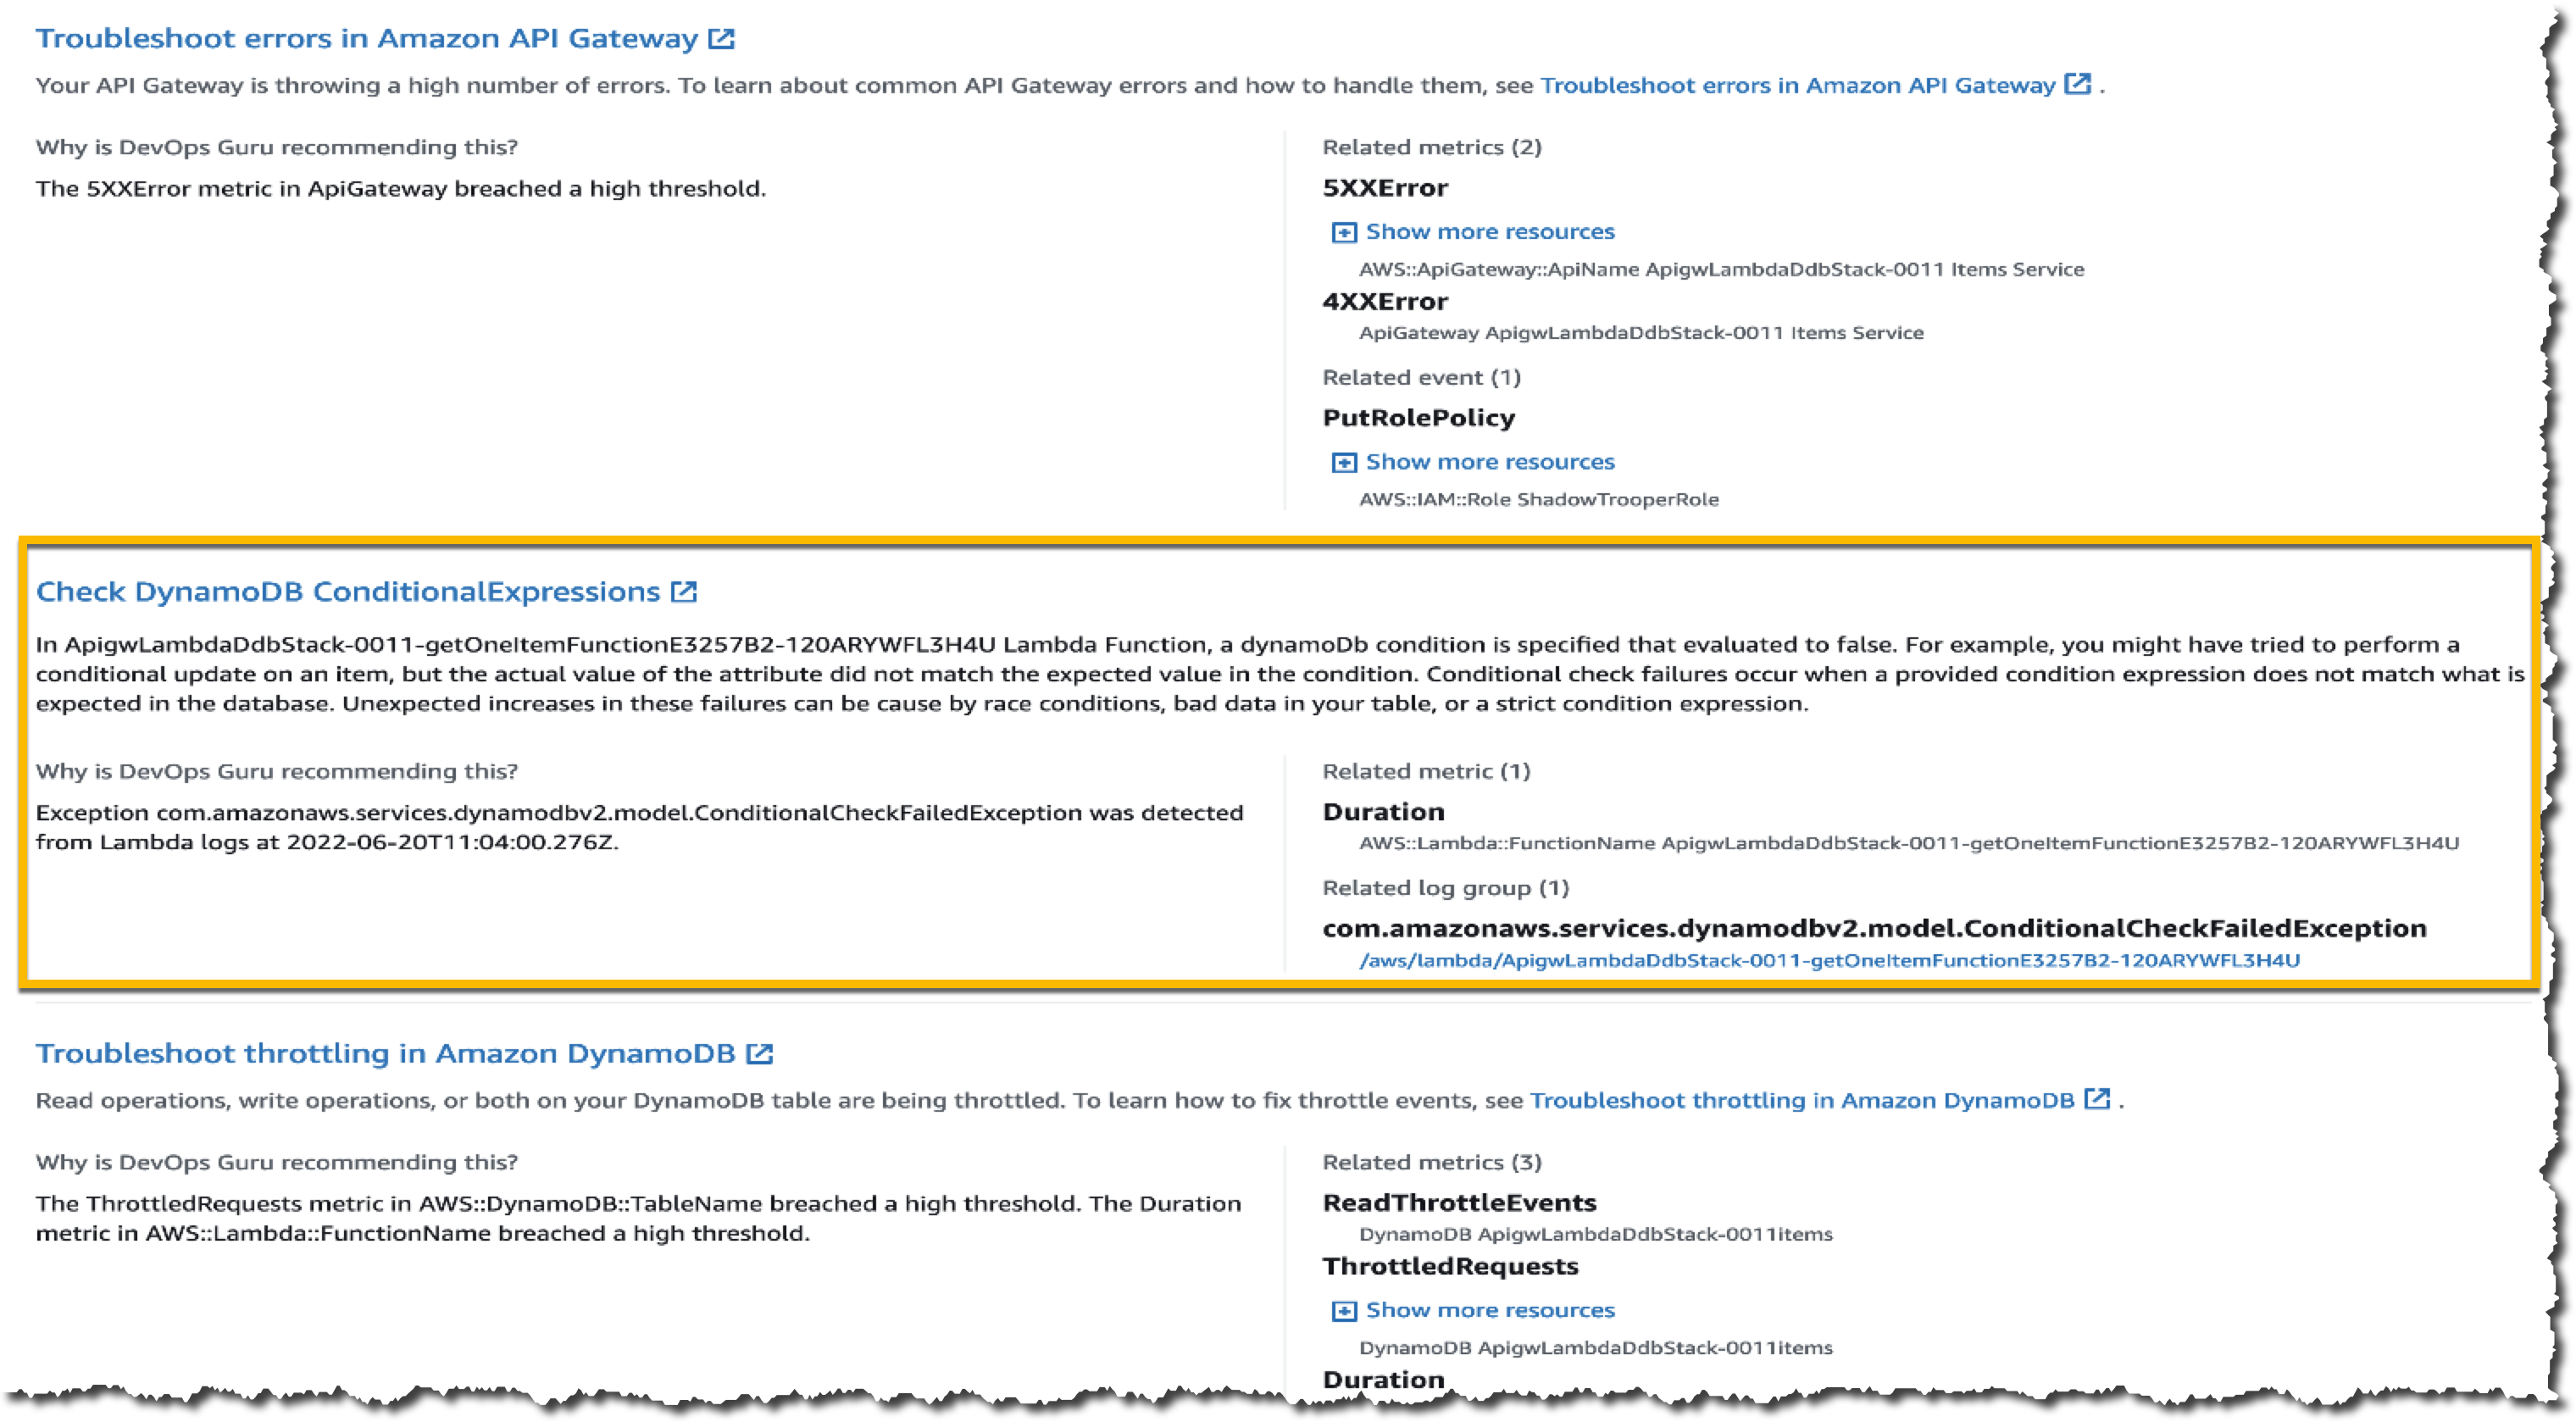
In addition to anomaly detection of logs, this new feature also provides precise recommendations based on the findings in the logs. You can find these recommendations on the Insights page, by scrolling down to find the Recommendations section.
Here, I get some recommendations from DevOps Guru, which make it easier for me to take immediate steps to remediate the issue. One recommendation shown in the following image is Check DynamoDB ConditionalExpression, which relates to an anomaly found in the logs derived from AWS Lambda.
Availability
You can use DevOps Guru Log Anomaly Detection and Recommendations today at no additional charge in all Regions where DevOps Guru is available, US East (Ohio), US East (N. Virginia), US West (Oregon), Asia Pacific (Singapore), Asia Pacific (Sydney), Asia Pacific (Tokyo), Europe (Frankfurt), Europe (Ireland), and Europe (Stockholm).
To learn more, please visit Amazon DevOps Guru web site and technical documentation, and get started today.
Happy building
— Donnie

